

| 일 | 월 | 화 | 수 | 목 | 금 | 토 |
|---|---|---|---|---|---|---|
| 1 | 2 | 3 | 4 | 5 | ||
| 6 | 7 | 8 | 9 | 10 | 11 | 12 |
| 13 | 14 | 15 | 16 | 17 | 18 | 19 |
| 20 | 21 | 22 | 23 | 24 | 25 | 26 |
| 27 | 28 | 29 | 30 |
- load balancer
- EC2
- ALB
- EC2 인스턴스
- vmware
- Firewall
- Ebs
- FTP
- SAA-C03
- tftp
- DNS
- Troubleshooting
- aws SAA-c03
- GNS3
- IAM
- AWS 자격증
- NAT
- aws cloud
- aws cloud school
- vyos
- aws iam
- docker
- KUBECTL
- linux
- 네트워크
- aws cloud shcool 8
- aws saa
- 쿠버네티스
- Kubernetes
- AWS
- Today
- Total
나의 공부기록
[VMWare] 23-1. 서버 모니터링 - telegraf, influxdb, grafana 본문
서버 모니터링
서버 모니터링 과정
1. 자료 수집 - telegraf
- 어떤 서버의, 어떤 리소스를, 얼마의 간격으로 수집할지
➡️ resource - CPU, RAM, Storage, I/O 등... 원하는 대부분의 리소스의 상태, 사용량을 수집 가능

- 타 서버를 모니터링하기 위해서는 모니터링 대상에 데이터를 수집할 agent가 필요함
➡️ agent가 데이터를 수집해서 influxDB에 데이터를 저장
2. 수집 데이터 저장 - influxDB
- 어떤 규칙에 의해 저장
- influxDB : 시계열(time-series) 데이터베이스
➡️ 일정한 시간간격으로 수집된 데이터를 DB에 저장
3. 데이터 시각화 - grafana(시각화에서 대표적으로 사용됨)
- 저장된 데이터를 토대로 그래프를 그리거나 수치를 표현
- AWS는 CloudWatch를 통해서 시각화해서 모니터링함
서버 모니터링 구성 과정

1. 서버 생성
- spec
- 2core, 2GB, 20GB
- IP : 211.183.3.99/24
- SELinux 비활성화
[root@mon ~]# sed -i s/SELINUX=enforcing/SELINUX=disabled/g /etc/selinux/config- 방화벽 해제
[root@mon ~]# systemctl stop firewalld
[root@mon ~]# systemctl disable firewalld
Removed symlink /etc/systemd/system/multi-user.target.wants/firewalld.service.
Removed symlink /etc/systemd/system/dbus-org.fedoraproject.FirewallD1.service.- 레포지토리 수정
[root@mon ~]# cat <<EOF > /etc/yum.repos.d/CentOS-Base.repo
> [base]
> name=CentOS-$releasever - Base
> #mirrorlist=http://mirrorlist.centos.org/?release=$releasever&arch=$basearch&repo=os&infra=$infra
> baseurl=https://vault.centos.org/7.9.2009/os/x86_64/
> gpgcheck=1
> gpgkey=file:///etc/pki/rpm-gpg/RPM-GPG-KEY-CentOS-7
>
> #released updates
> [updates]
> name=CentOS-$releasever - Updates
> #mirrorlist=http://mirrorlist.centos.org/?release=$releasever&arch=$basearch&repo=updates&infra=$infra
> baseurl=https://vault.centos.org/7.9.2009/updates/x86_64/
> gpgcheck=1
> gpgkey=file:///etc/pki/rpm-gpg/RPM-GPG-KEY-CentOS-7
>
> #additional packages that may be useful
> [extras]
> name=CentOS-$releasever - Extras
> #mirrorlist=http://mirrorlist.centos.org/?release=$releasever&arch=$basearch&repo=extras&infra=$infra
> baseurl=https://vault.centos.org/7.9.2009/extras/x86_64/
> gpgcheck=1
> gpgkey=file:///etc/pki/rpm-gpg/RPM-GPG-KEY-CentOS-7
>
> #additional packages that extend functionality of existing packages
> [centosplus]
> name=CentOS-$releasever - Plus
> #mirrorlist=http://mirrorlist.centos.org/?release=$releasever&arch=$basearch&repo=centosplus&infra=$infra
> baseurl=https://vault.centos.org/7.9.2009/centosplus/x86_64/
> gpgcheck=1
> enabled=0
> gpgkey=file:///etc/pki/rpm-gpg/RPM-GPG-KEY-CentOS-7
>
> #contrib - packages by Centos Users
> [contrib]
> name=CentOS-$releasever - Contrib
> #mirrorlist=http://mirrorlist.centos.org/?release=$releasever&arch=$basearch&repo=contrib&infra=$infra
> baseurl=https://vault.centos.org/7.9.2009/contrib/x86_64/
> gpgcheck=1
> enabled=0
> gpgkey=file:///etc/pki/rpm-gpg/RPM-GPG-KEY-CentOS-7
> EOF
2. telegraf 설정
2-1. telegraf 및 influxdb 설치를 위한 레포지토리 수정
cat <<EOF | sudo tee /etc/yum.repos.d/influxdb.repo
[influxdb]
name = InfluxDB Repository - RHEL \$releasever
baseurl = https://repos.influxdata.com/rhel/\$releasever/\$basearch/stable
enabled = 1
gpgcheck = 0
gpgkey = https://repos.influxdata.com/influxdb.key
EOF
2-2. 패키지 설치
[root@mon ~]# yum install -y telegraf
2-3. telegraf 설정 파일 수정
- /etc/telegraf/telegraf.conf : telegraf 설정 파일
- influxDB에 데이터 저장하기 위한 정보를 설정
- 수집 데이터 설정
[root@mon ~]# vi /etc/telegraf/telegraf.conf

[수정 내용]
1) ggdG : 전체 삭제
2) 내용 추가
[global_tags]

# Configuration for telegraf agent
[agent]
    interval = "10s"
    debug = false
    hostname = "server-hostname"
    round_interval = true
    flush_interval = "10s"
    flush_jitter = "0s"
    collection_jitter = "0s"
    metric_batch_size = 1000
    metric_buffer_limit = 10000
    quiet = false
    logfile = ""
    omit_hostname = false

###############################################################################
#                                  OUTPUTS                                    #
###############################################################################

[[outputs.influxdb]]
    urls = ["http://localhost:8086"] # InfluxDB가 설치된 서버의 IP를
    database = "telegraf" # 데이터베에스 이름, 생성이 되어있지 않으면 자동 생성됨
    timeout = "10s"
    username = "admin" # InfluXDB 기본 계정
    password = "admin"
    retention_policy = ""

###############################################################################
#                                  INPUTS                                     #
###############################################################################

[[inputs.cpu]]
    percpu = true
    totalcpu = true
    collect_cpu_time = false
    report_active = false
[[inputs.disk]]
    ignore_fs = ["tmpfs", "devtmpfs", "devfs"]
[[inputs.diskio]]
[[inputs.mem]]
[[inputs.net]]
[[inputs.system]]
[[inputs.swap]]
[[inputs.netstat]]
[[inputs.processes]]
[[inputs.kernel]]
3. influxdb
3-1. influxdb 패키지 설치
[root@mon ~]# yum install -y influxdb
3-2. influxdb 상태 확인 및 시작&활성화 설정
# 상태 확인
[root@mon ~]# systemctl status influxdb
● influxdb.service - InfluxDB is an open-source, distributed, time series database
   Loaded: loaded (/usr/lib/systemd/system/influxdb.service; disabled; vendor preset: disabled)
   Active: inactive (dead)
     Docs: https://docs.influxdata.com/influxdb/

# influxdb start & enable 설정
[root@mon ~]# systemctl enable --now influxdb
Created symlink from /etc/systemd/system/influxd.service to /usr/lib/systemd/system/influxdb.service.
Created symlink from /etc/systemd/system/multi-user.target.wants/influxdb.service to /usr/lib/systemd/system/influxdb.service.
3-3. influxdb 접속 및 database 목록 확인
- influx = mysql -u root -p 와 같은 명령어
# influxdb 접속
[root@mon ~]# influx
Connected to http://localhost:8086 version v1.11.8
InfluxDB shell version: v1.11.8

# database 목록 확인
> show databases;
name: databases
name
----
_internal
> exit
4. telegraf 시작 및 활성화
- influxdb를 설치및 활성화한 후에, telegraf를 시작해야 database가 생성됨
[root@mon ~]# systemctl enable --now telegraf
5. influxdb 데이터베이스 확인
[root@mon ~]# influx
Connected to http://localhost:8086 version v1.11.8
InfluxDB shell version: v1.11.8
> show databases;
name: databases
name
----
_internal
telegraf
➡️telegraf를 동작시키면 telegraf.conf에서 구성한 대로 수집한 자료를 influxdb의 telegraf라는 db에 저장시킬 것
6. 데이터 수집 확인
# telegraf 데이터베이스 선택
> use telegraf
Using database telegraf

# 데이터 누적 확인
> select * from cpu where time > now() -60s;
name: cpu
time                cpu       host            usage_guest usage_guest_nice usage_idle        usage_iowait        usage_irq usage_nice usage_softirq        usage_steal usage_system        usage_user
----                ---       ----            ----------- ---------------- ----------        ------------        --------- ---------- -------------        ----------- ------------        ----------
1741141380000000000 cpu-total server-hostname 0           0                99.79777553083942 0                   0         0          0                    0           0.15166835187057331 0.050556117290191105
1741141380000000000 cpu0      server-hostname 0           0                99.79777553083942 0                   0         0          0                    0           0.2022244691607734  0
1741141380000000000 cpu1      server-hostname 0           0                99.79757085020147 0                   0         0          0                    0           0.10121457489878215 0.10121457489879114
1741141390000000000 cpu-total server-hostname 0           0                99.79797979797884 0                   0         0          0                    0           0.15151515151515588 0.050505050505057936
1741141390000000000 cpu0      server-hostname 0           0                99.69758064516157 0                   0         0          0.10080645161290346  0           0.1008064516129015  0.1008064516129015
1741141390000000000 cpu1      server-hostname 0           0                99.59677419354875 0                   0         0          0                    0           0.3024193548387134  0.1008064516129015
1741141400000000000 cpu-total server-hostname 0           0                99.69293756397163 0                   0         0          0.051177072671443335 0           0.2047082906857688  0.0511770726714422
1741141400000000000 cpu0      server-hostname 0           0                99.79529170931325 0                   0         0          0                    0           0.1023541453428832  0.1023541453428832
1741141400000000000 cpu1      server-hostname 0           0                99.69230769230798 0                   0         0          0.10256410256410266  0           0.20512820512820076 0
1741141410000000000 cpu-total server-hostname 0           0                99.64521033958471 0.05068423720223069 0         0          0                    0           0.20273694880892726 0.10136847440445913
1741141410000000000 cpu0      server-hostname 0           0                99.79736575481274 0                   0         0          0                    0           0.10131712259371613 0.10131712259372513
1741141410000000000 cpu1      server-hostname 0           0                99.49290060851973 0                   0         0          0                    0           0.40567951318458867 0.1014198782961449
1741141420000000000 cpu-total server-hostname 0           0                99.59287531806653 0                   0         0          0.05089058524173009  0           0.30534351145037375 0.05089058524172896
1741141420000000000 cpu0      server-hostname 0           0                99.79633401222014 0                   0         0          0                    0           0.2036659877800444  0
1741141420000000000 cpu1      server-hostname 0           0                99.4908350305492  0.10183299389001876 0         0          0                    0           0.30549898167005857 0.1018329938900165
7. 시각화 툴 - grafana
7-1.레포지토리 수정
cat <<EOF | sudo tee /etc/yum.repos.d/grafana.repo
[grafana]
name=grafana
baseurl=https://packages.grafana.com/oss/rpm
repo_gpgcheck=1
enabled=1
gpgcheck=0
gpgkey=https://packages.grafana.com/gpg.key
sslverify=1
sslcacert=/etc/pki/tls/certs/ca-bundle.crt
EOF
7-2. grafana 패키지 설치
[root@mon ~]# yum install -y grafana
7-3. grafana 서버 시작 & 활성화
root@mon ~]# systemctl enable --now grafana-server
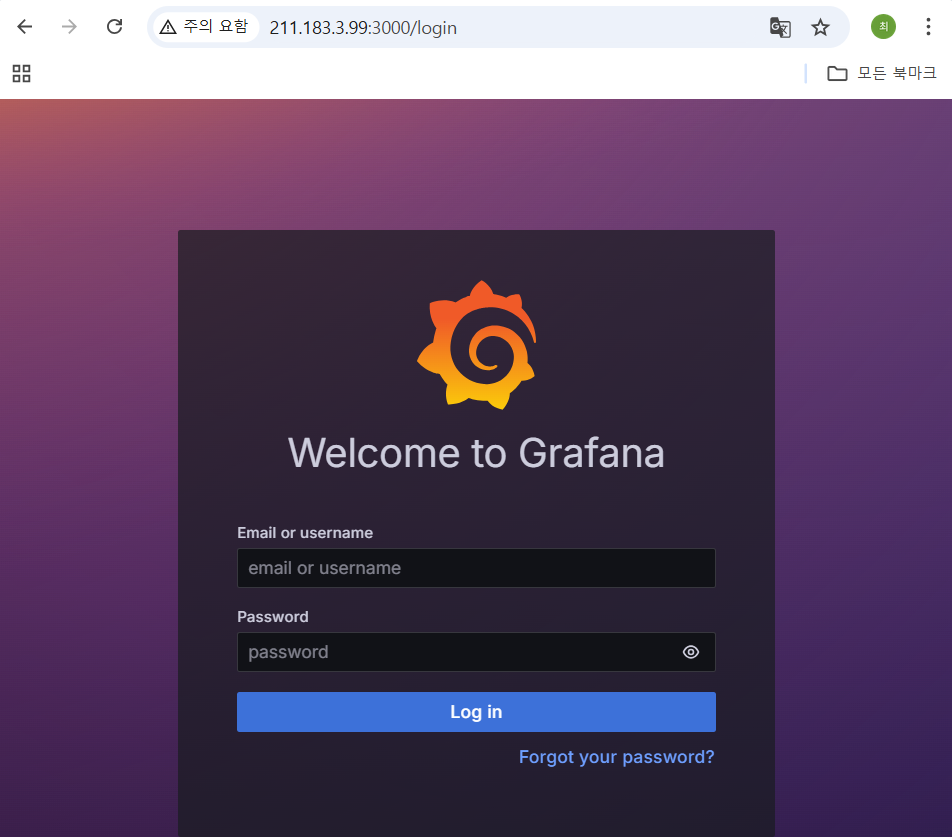
8. grafana-server 접속 확인
- grafana의 기본 port : 3000
- 현재 localhost를 모니터링하는 중
💡서버 모니터링을 위해 고려해야 할 것
1. 시각화할 데이터가 저장된 곳 (influxDB, prometheus 등...)
- prometheus : 데이터 수집 및 저장 가능 (= telegraf - influxDB)
2. 시각화할 대시보드
- 데이터를 어떤 방식으로 표현할지를 코드로 구현
➡️ 그래프 또는 수치화, percentage 등... 해당 실습에서는 다른 사람들이 제공하는 대시보드를 import 해서 사용할 예정
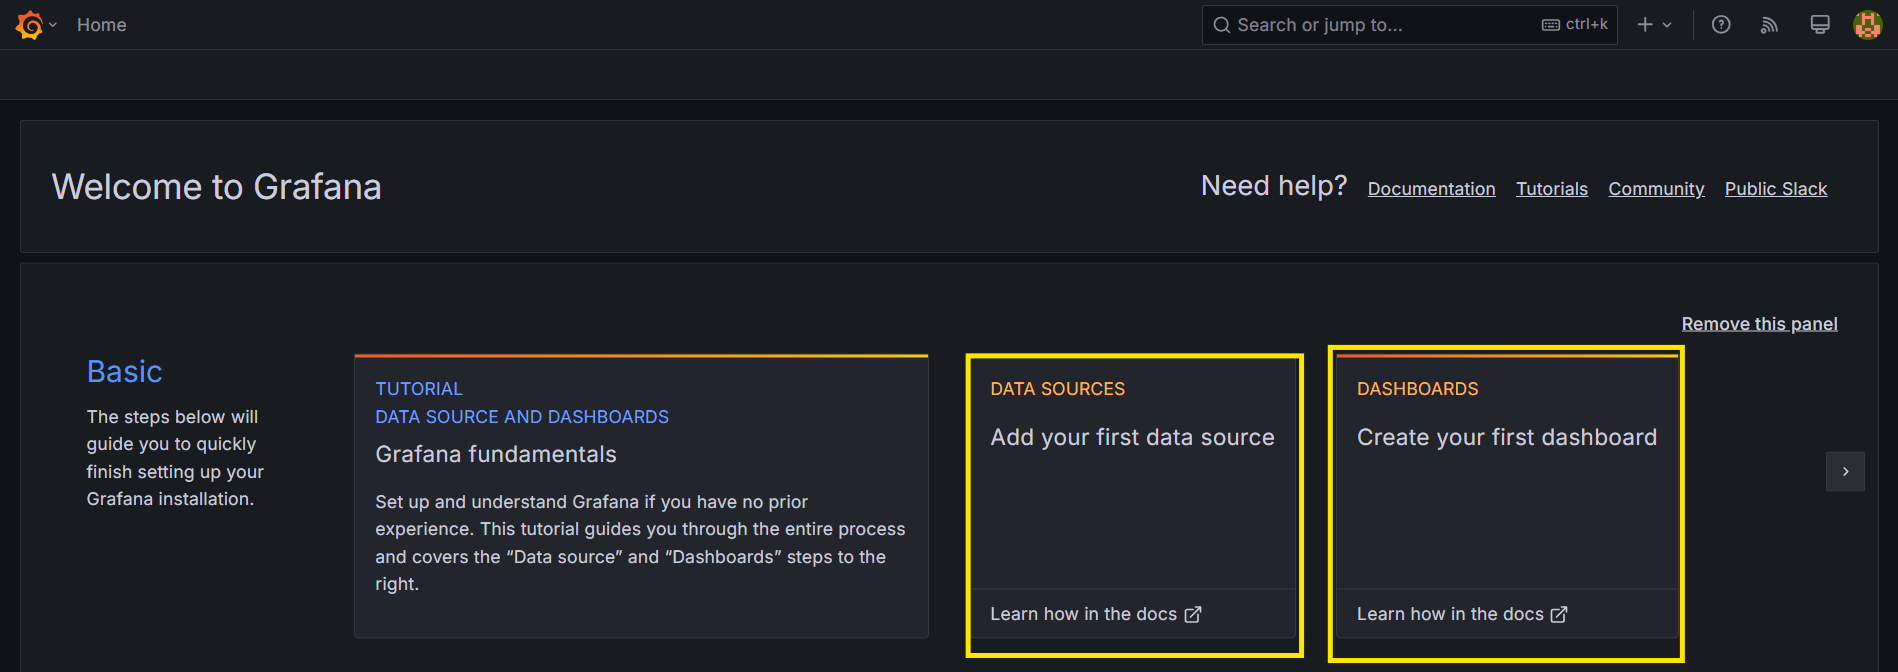
9. grafana 설정
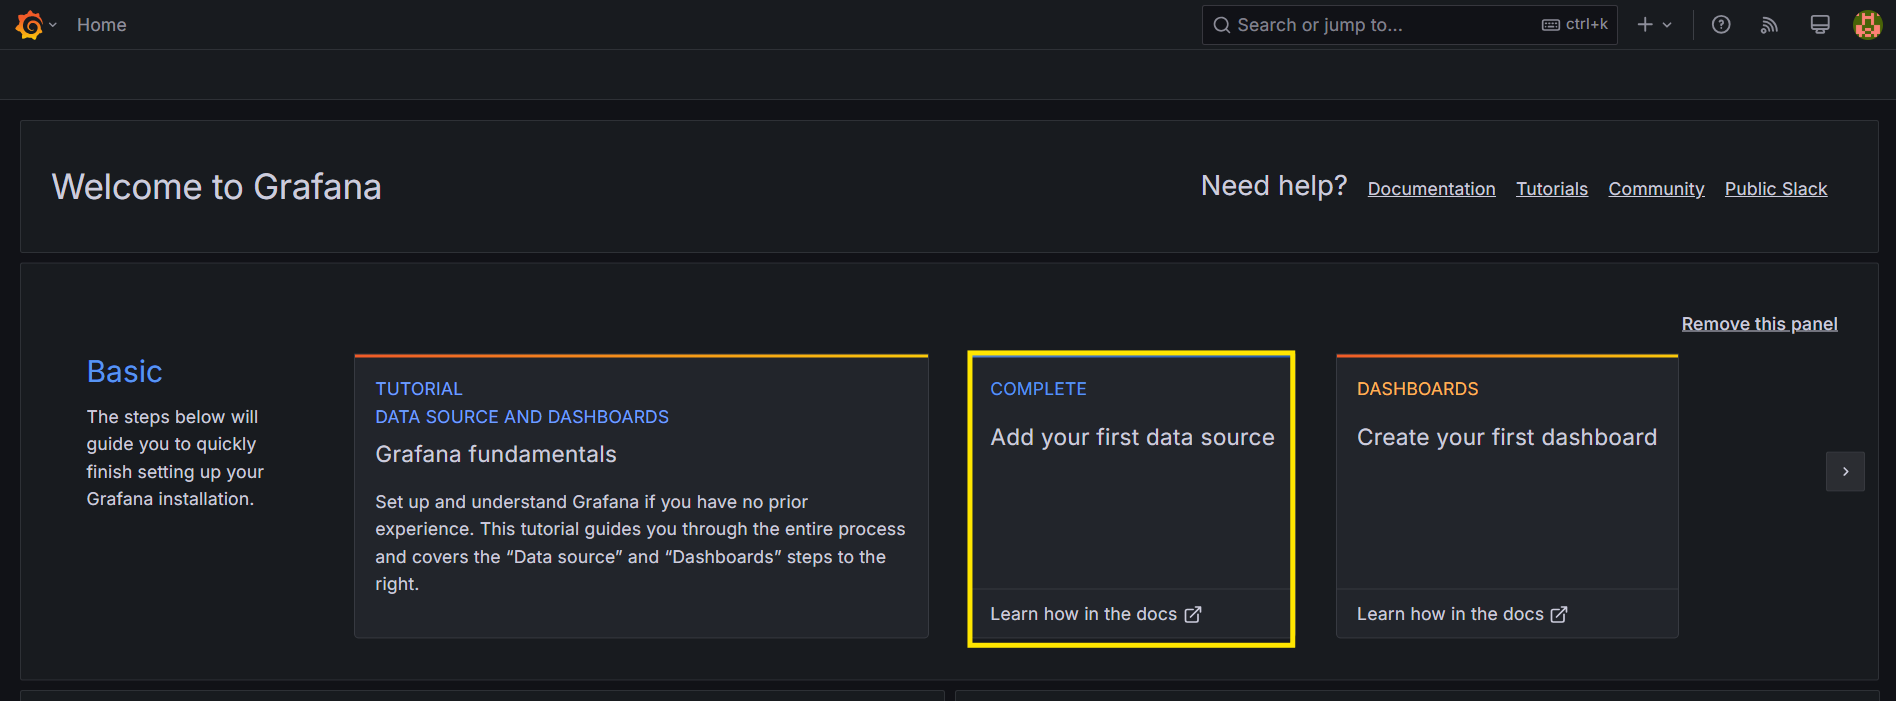
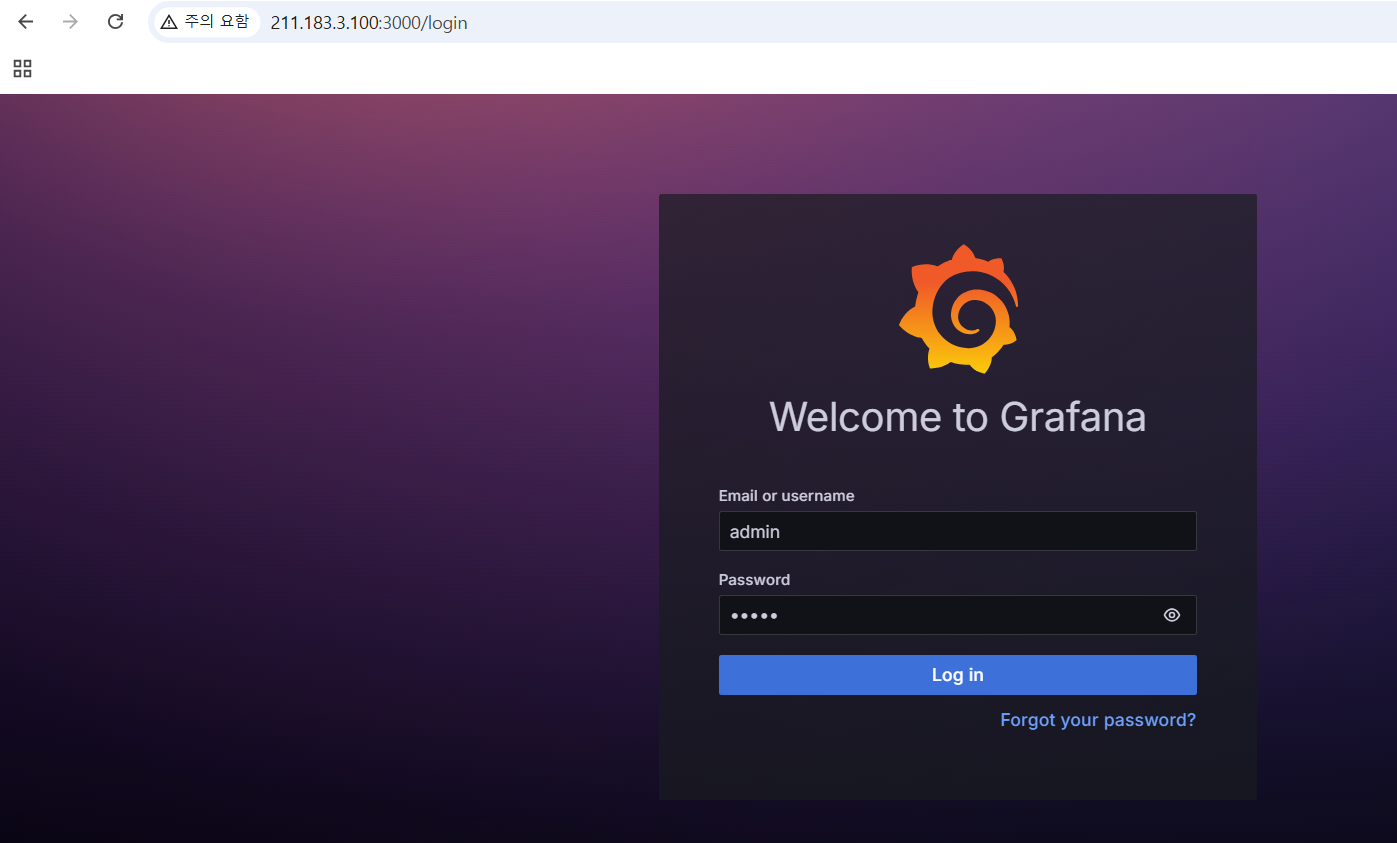
9-1. grafana 로그인
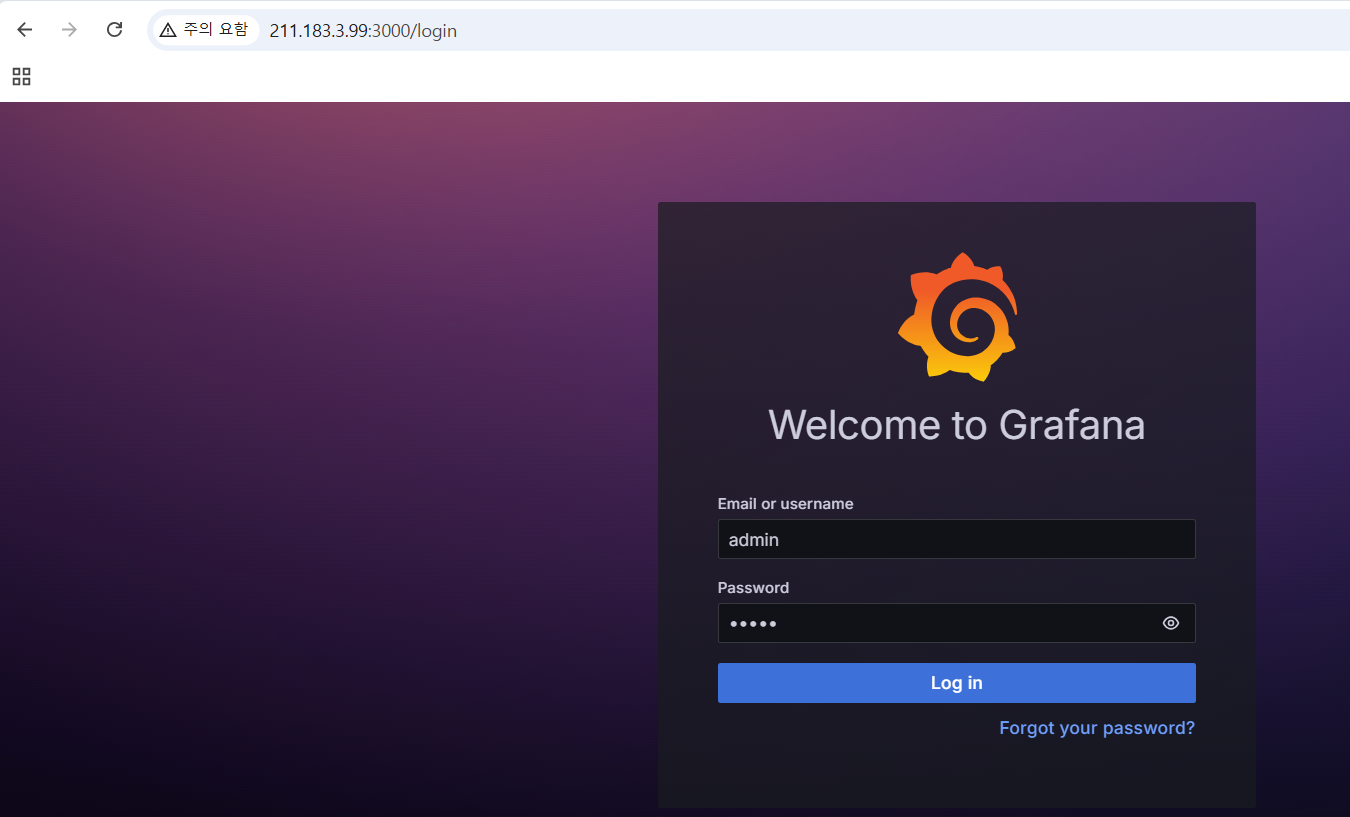
- DATA SOURCES : 수집되어 저장된 자료 = influxDB
- DASHBOARDS : 시각화 방식 = import 예정
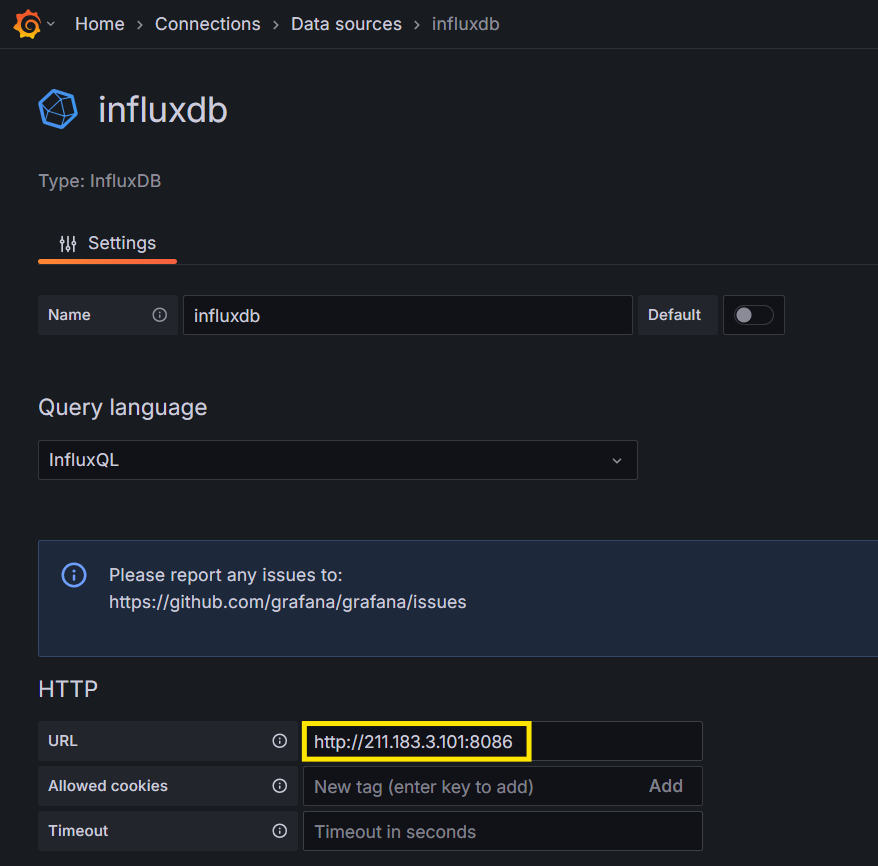
9-2. DATA SOURCES 설정
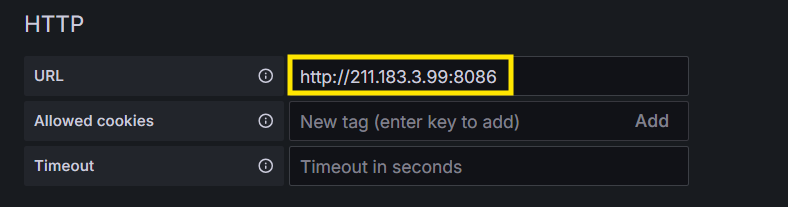
- influxDB 툴 선택 & influxDB 연결 설정
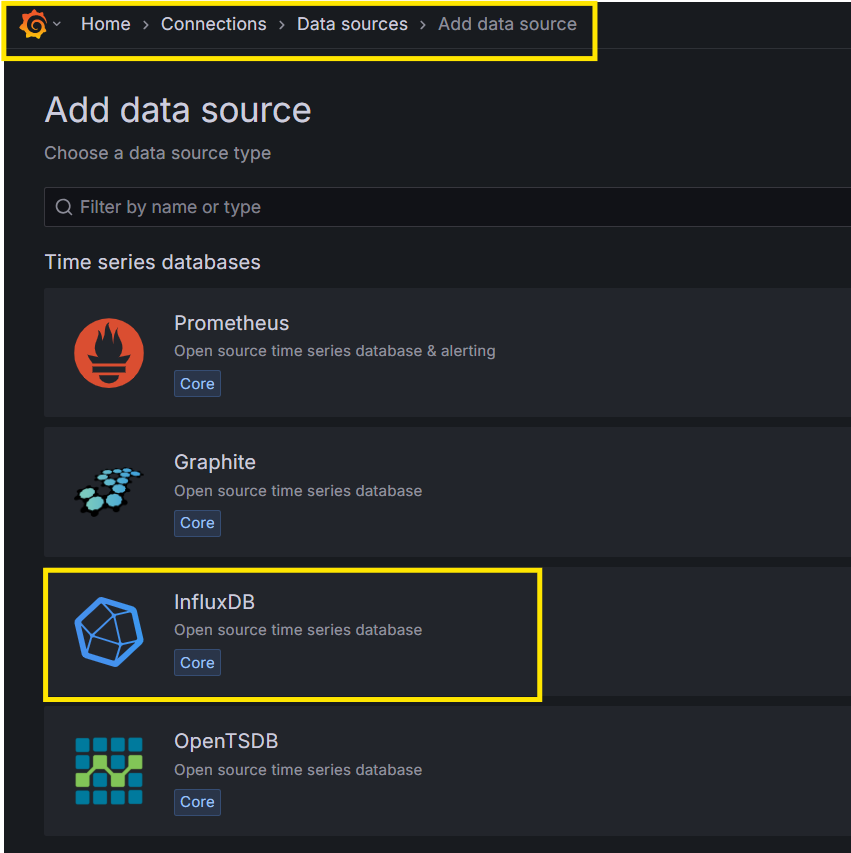
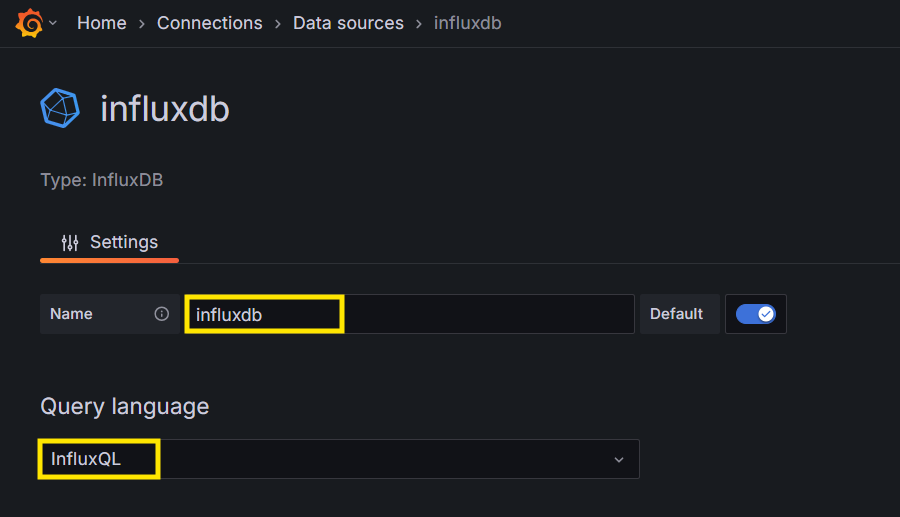
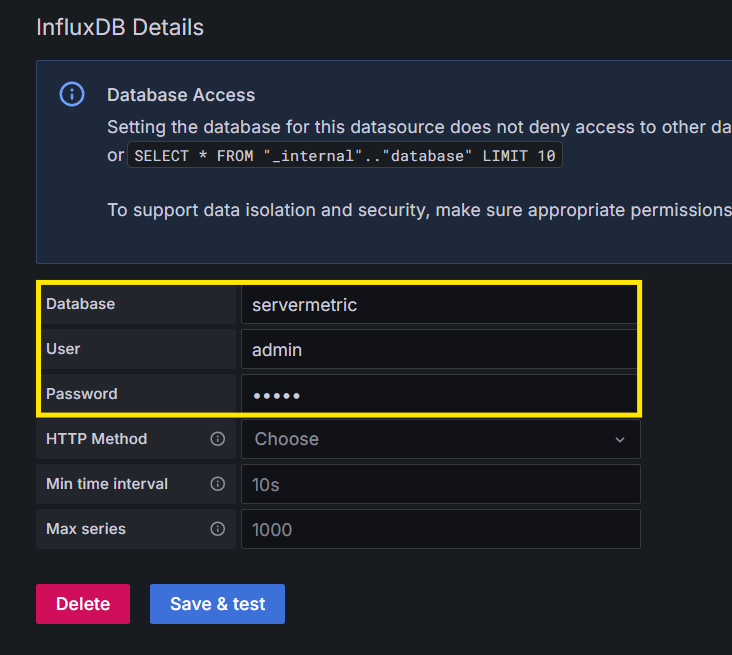
- telegraf.conf 파일에 설정한 DB 주소, DB 사용자, DB 비밀번호 입력
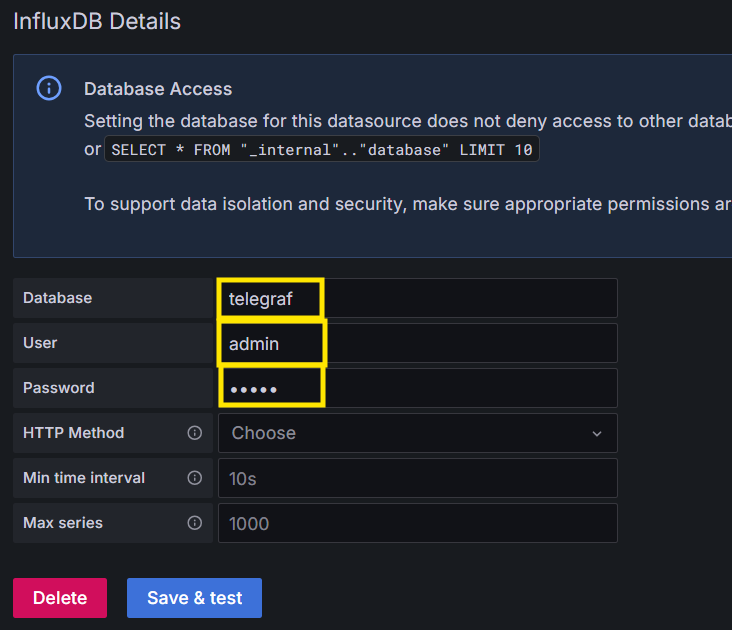
- DATA SOURCES 설정 성공확인
- DB 주소, DB 사용자, DB 비밀번호가 인증
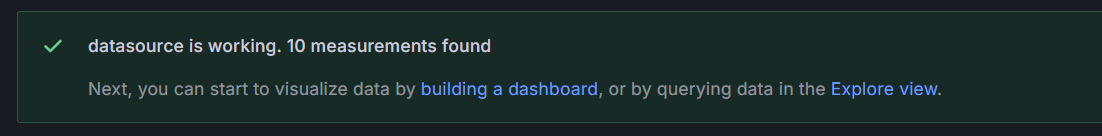
- 정상적으로 DB가 연결됨을 확인 가능
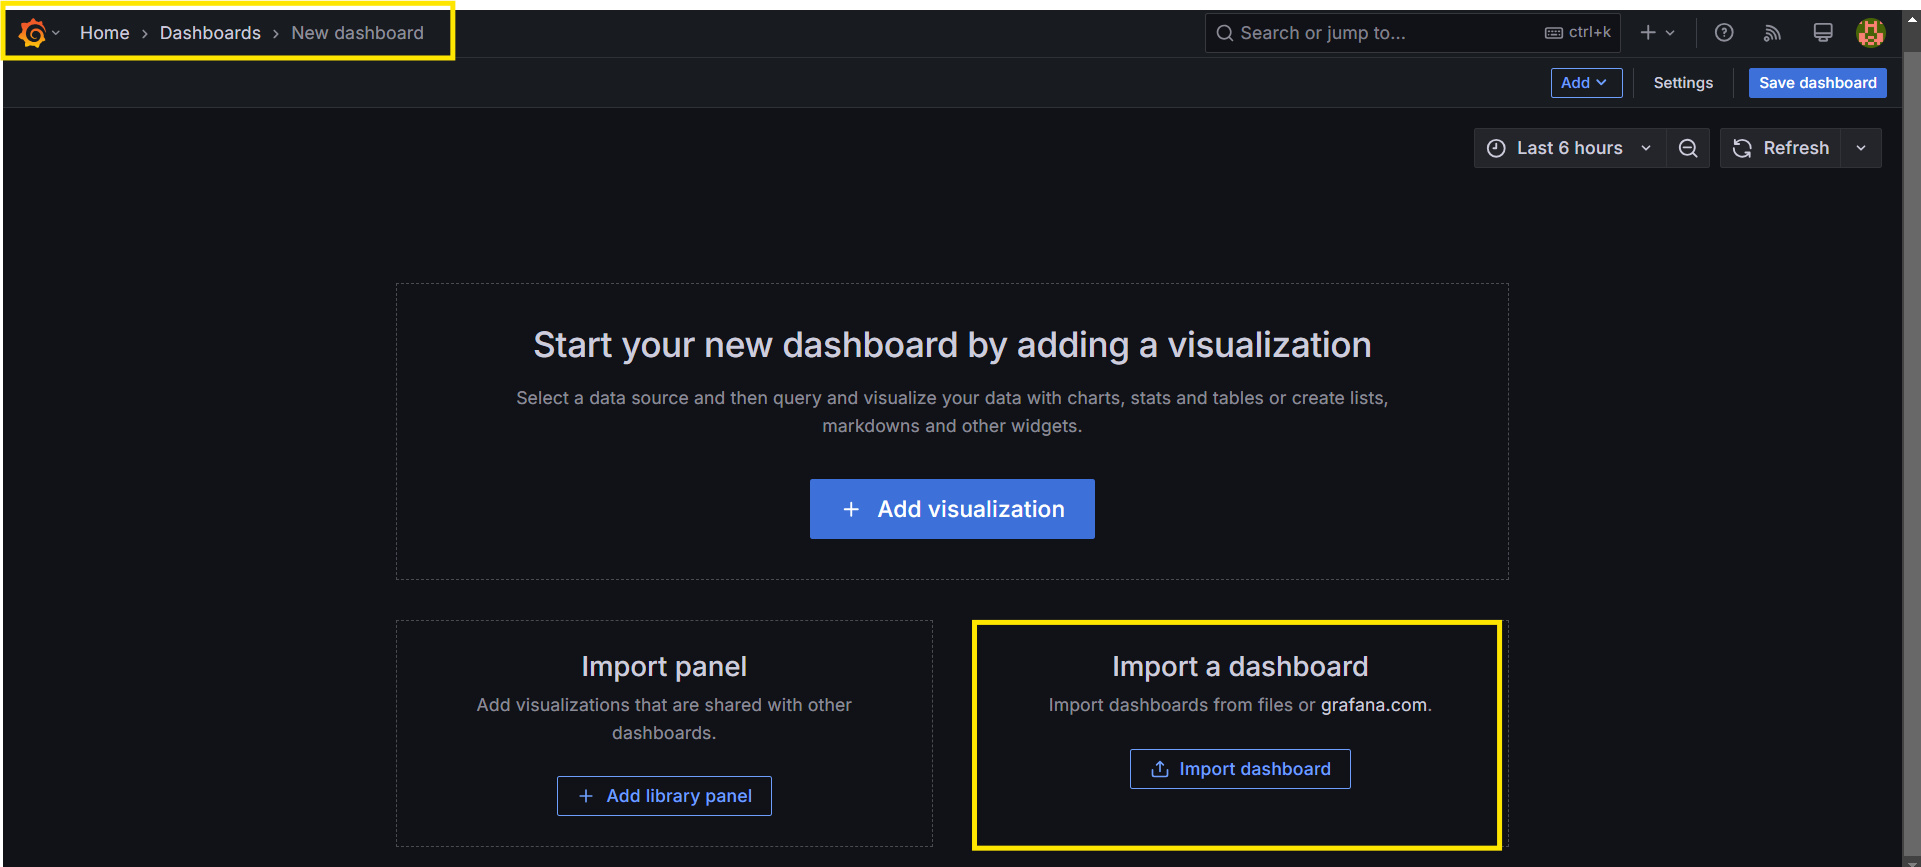
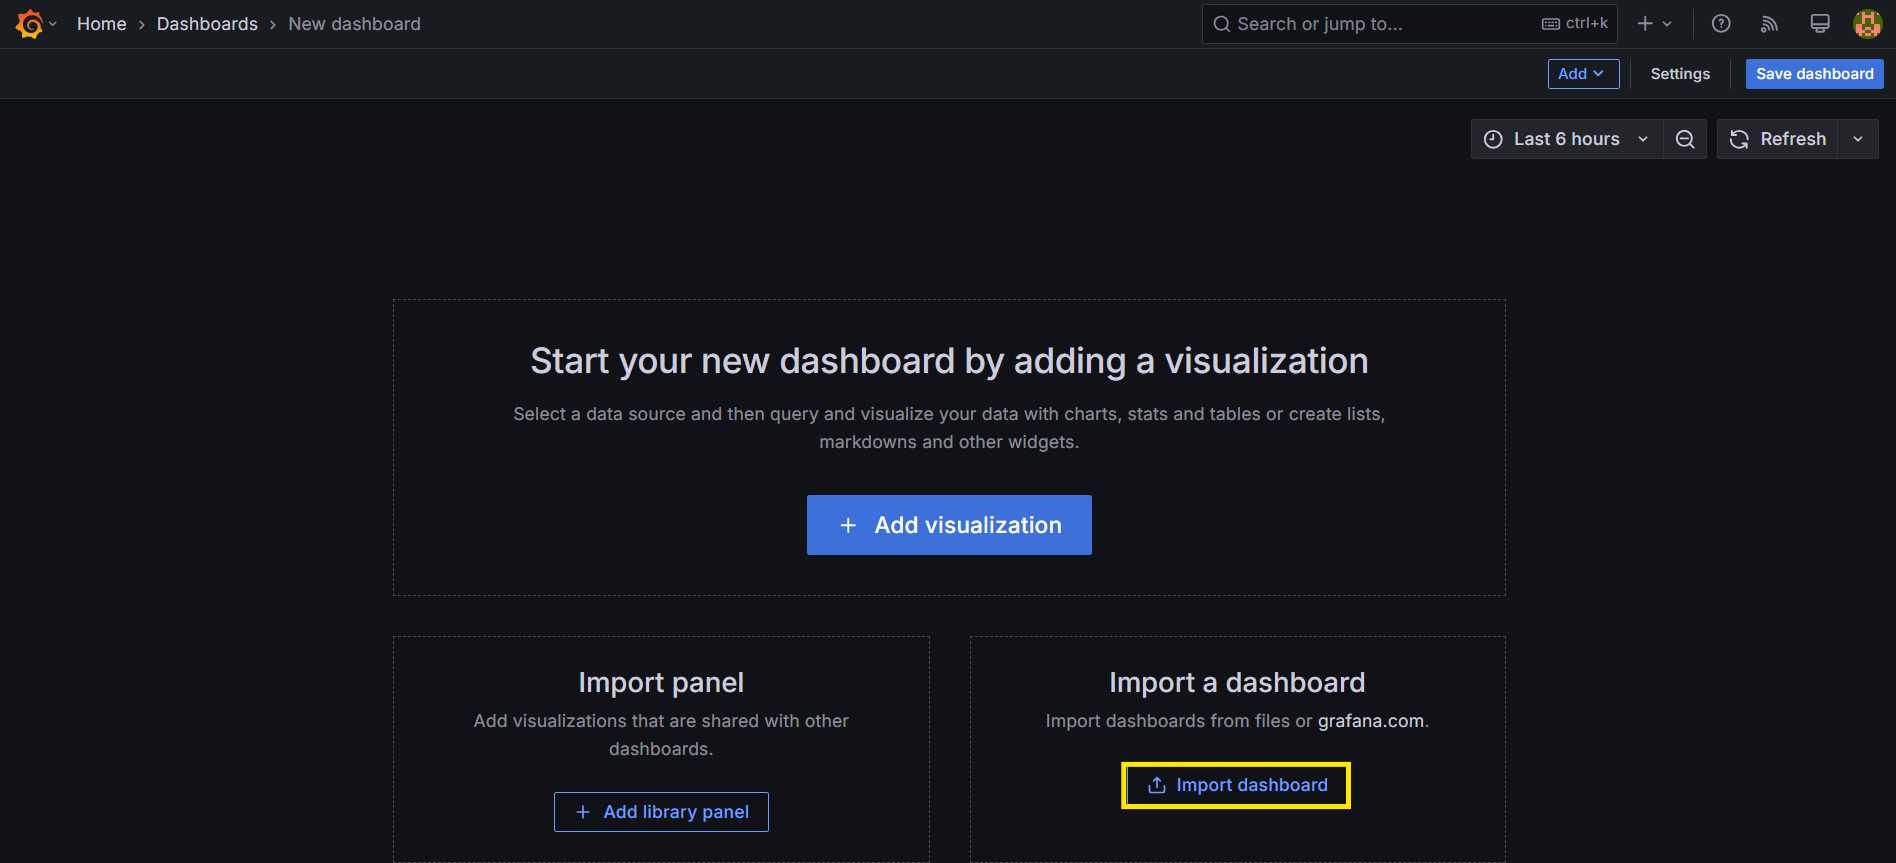
9-3. DASHBOARDS 설정
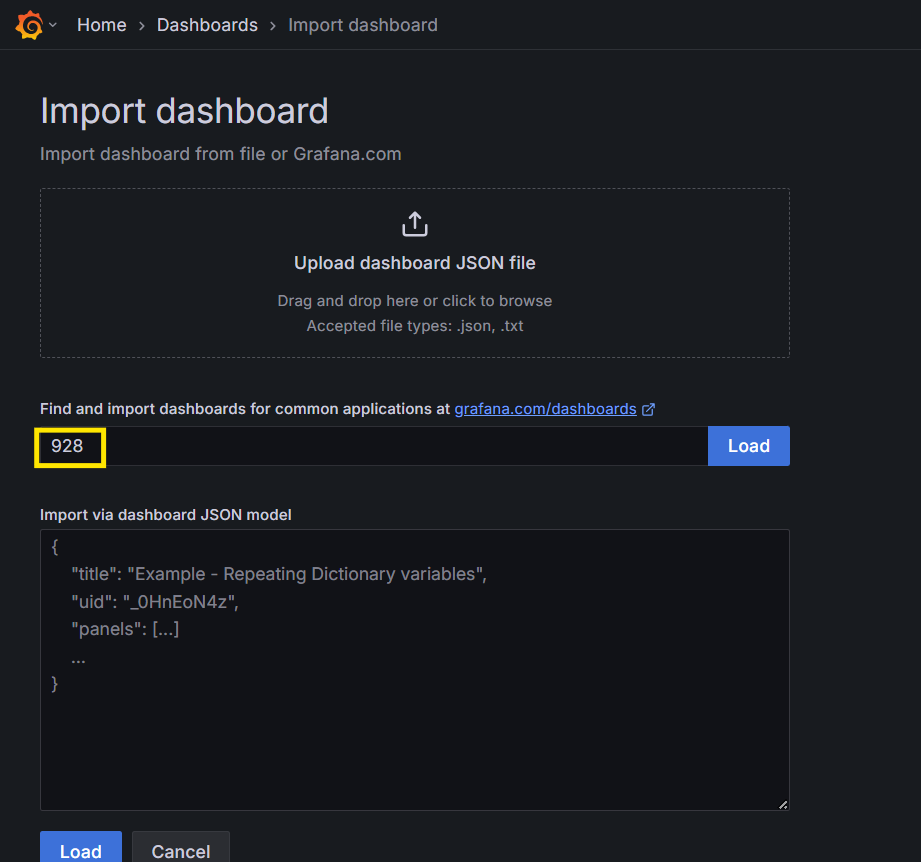
- DASHBOARD 템플릿 import

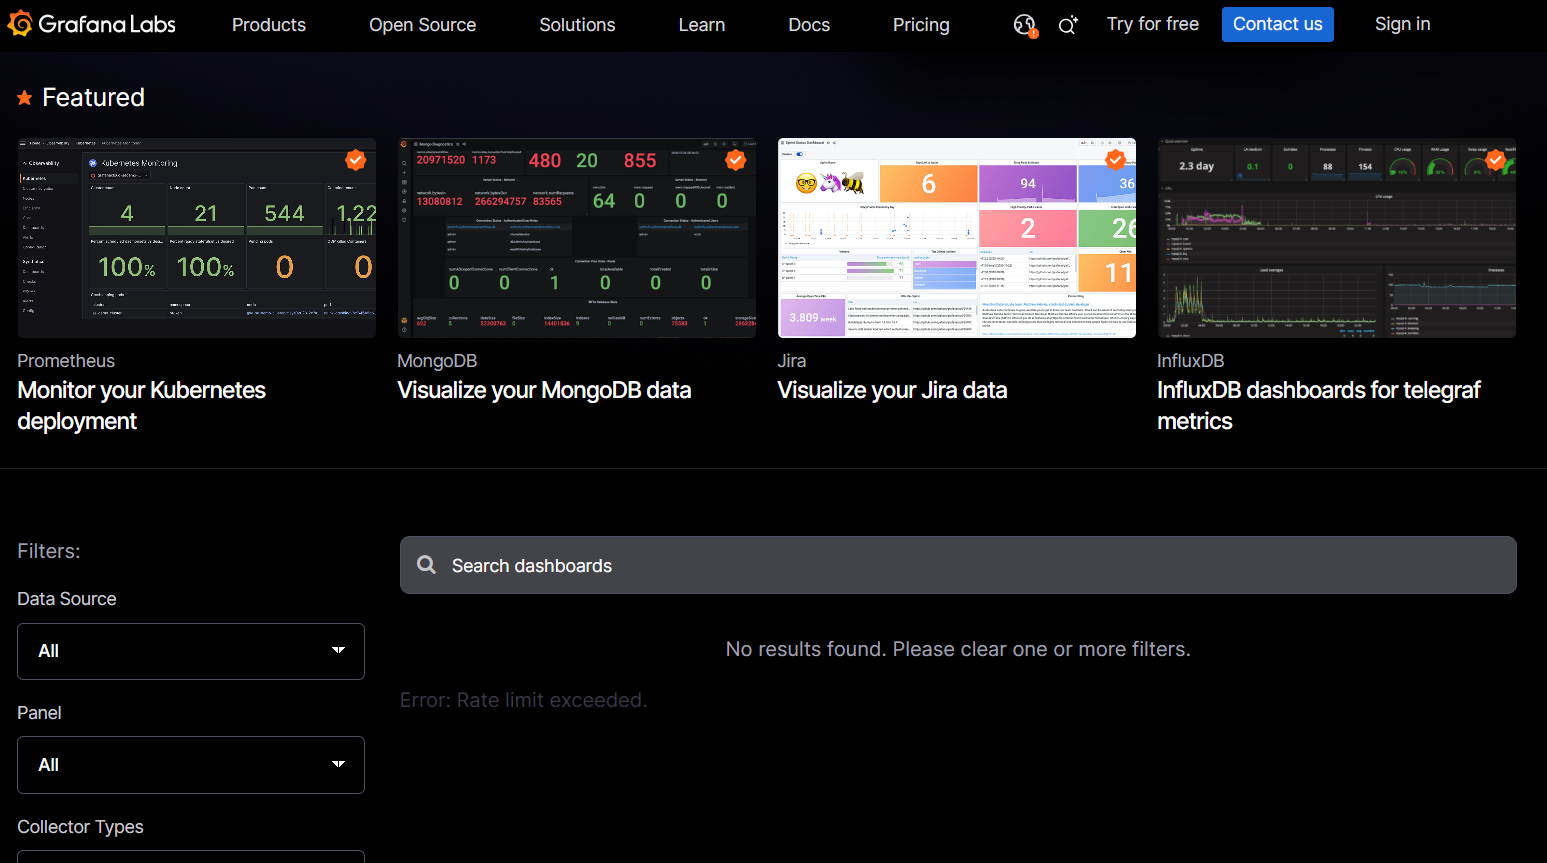
- grafana.com/dashboards : 제공되는 시각화 템플릿 선택
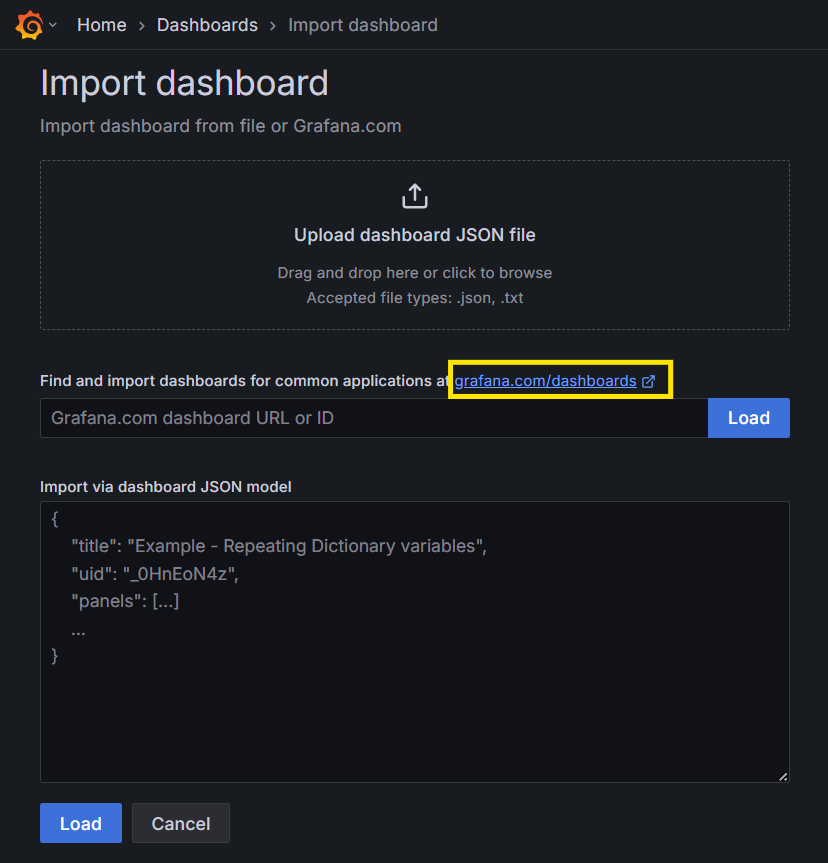
- 원하는 시각화 템플릿 선택 후, ID 값 입력
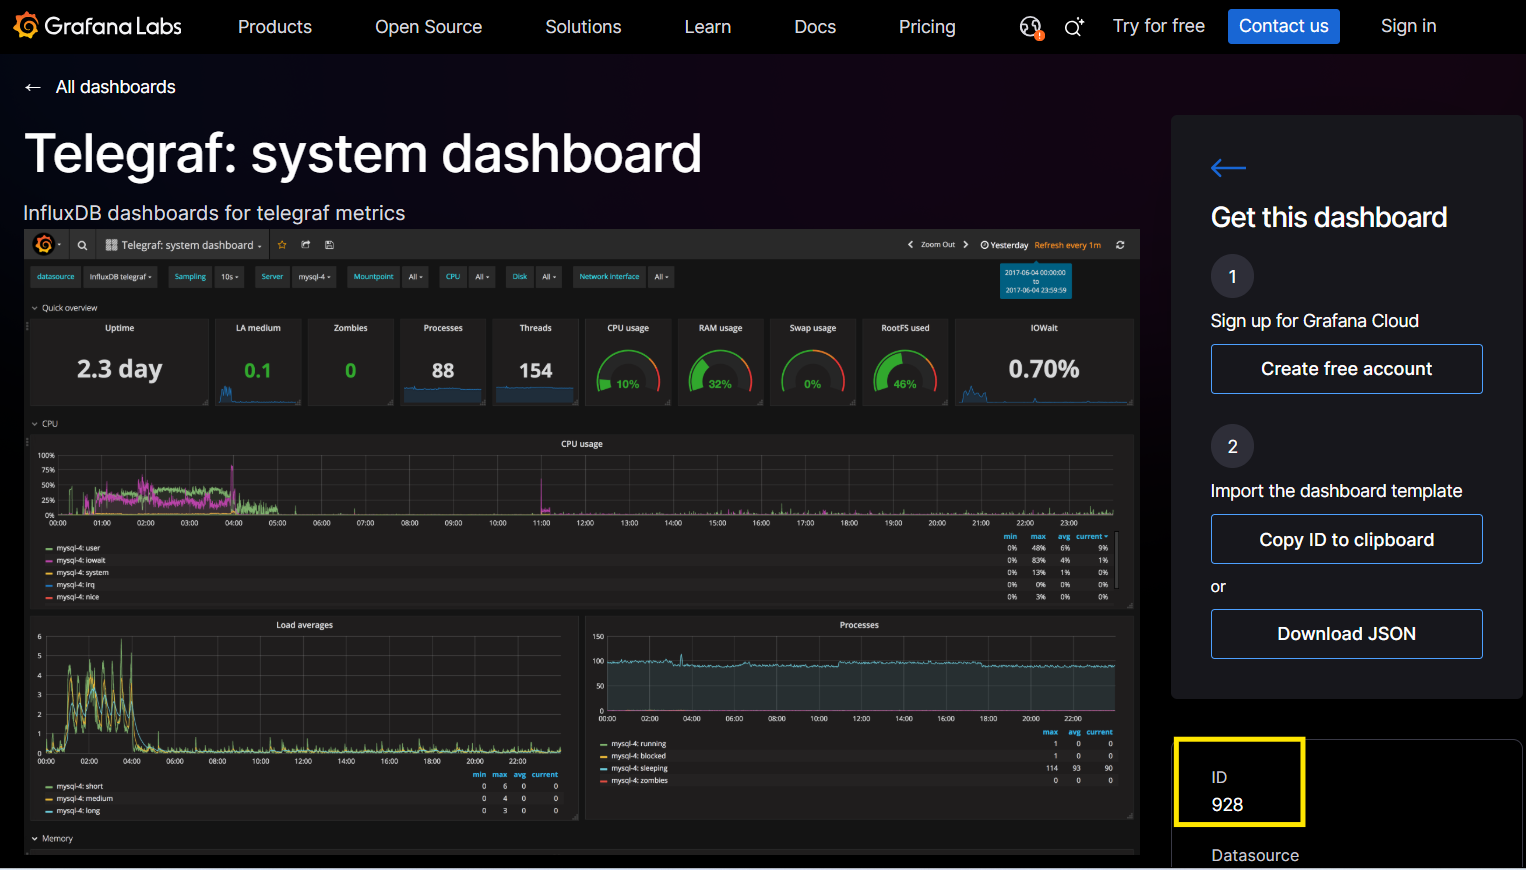
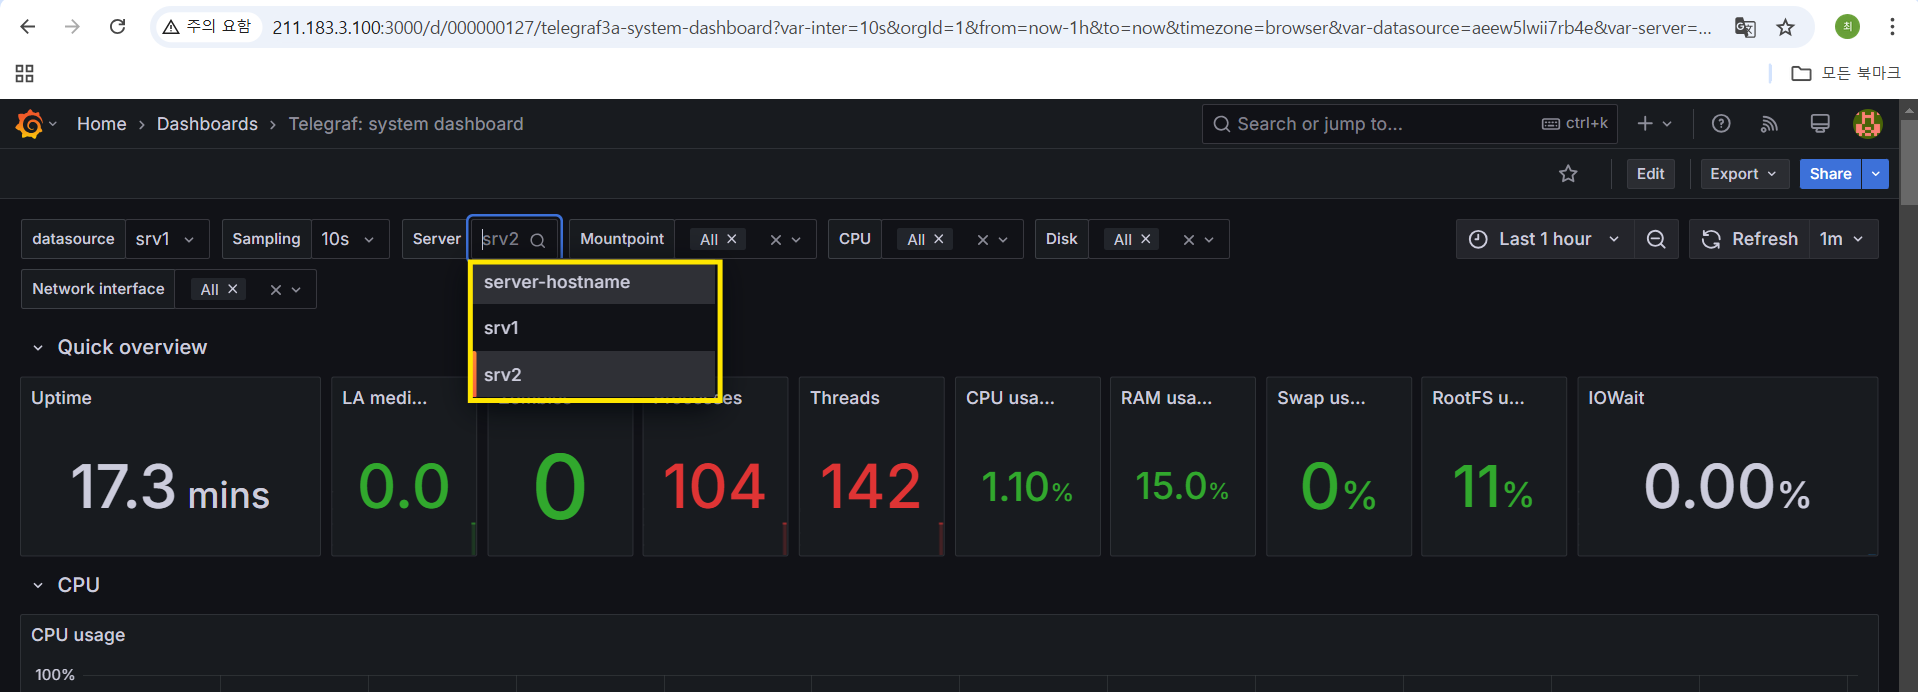
- DATA SOURCE의 이름 선택

- 시각화 확인 가능
10. 부하 테스트
- JMeter : 부하테스트 도구
- stress 패키지 : 부하 테스트 패키지
10-1. stress 패키지 설치
# 레포지토리 업데이트
[root@mon ~]# yum install -y epel-release

# stress 패키지 설치
[root@mon ~]# yum install -y stress
10-2. CPU 부하주기
[root@mon ~]# stress -c 2 -t 600
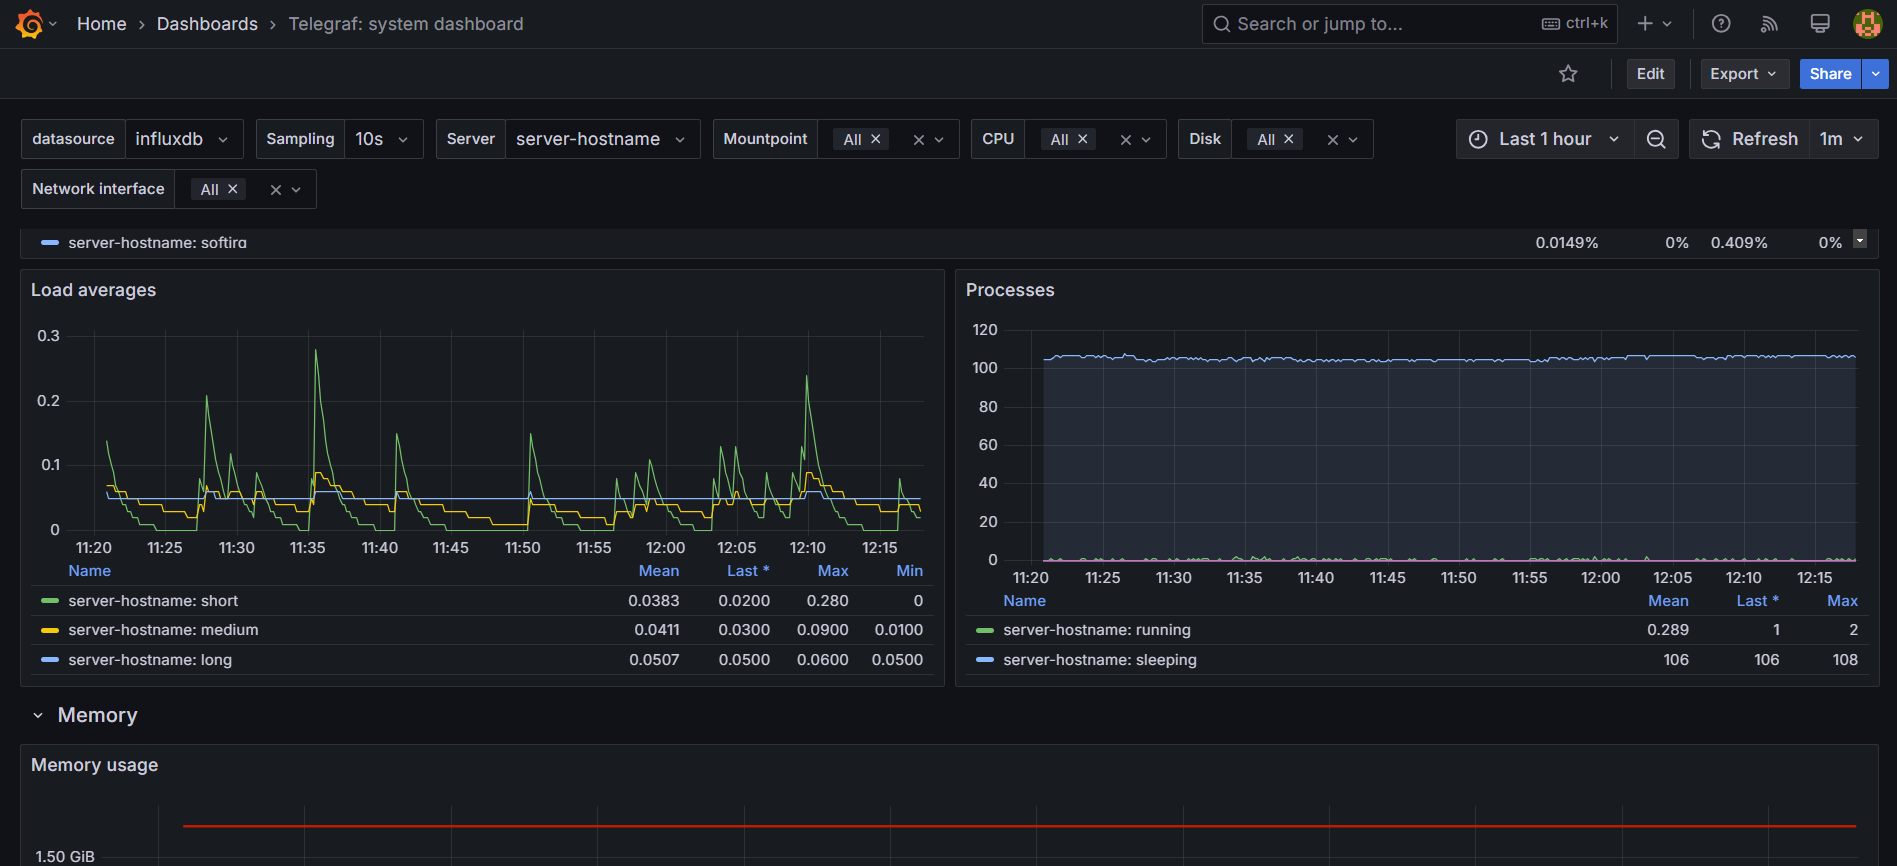
10-3. grafana 시각화 확인

실습
문제
최소 두 개 이상의 서버(srv1, srv2)를 telegraf와 influxDB, grafana를 통해 모니터링해 보세요.
srv1에는 grafana 설치, srv2에는 influxdb 설치
수집된 자료는 influxdb의 servermetric이라는 데이터베이스에 저장됐으면 좋겠다.
grafana dashboard는 ID 928로 하세요.
💡조건
모니터링하고자 하는 서버에 telegraf 설치
srv1 : grafana / srv2 : influxdb 설치
풀이
1. telegraf와 influxdb 설치를 위한 레포지토리 수정 - srv1 & srv2
[root@srv1-250305 ~]# cat <<EOF | sudo tee /etc/yum.repos.d/influxdb.repo
> [influxdb]
> name = InfluxDB Repository - RHEL \$releasever
> baseurl = https://repos.influxdata.com/rhel/\$releasever/\$basearch/stable
> enabled = 1
> gpgcheck = 0
> gpgkey = https://repos.influxdata.com/influxdb.key
> EOF
2. telegraf 패키지 설치
[root@srv1-250305 ~]# yum install -y telegraf
3. /etc/telegraf/telegraf.conf 파일 수정
- hostname 수정해야 grafana에서 server 구분 가능
[root@srv1-250305 ~]# vi /etc/telegraf/telegraf.conf

# Configuration for telegraf agent
[agent]
    interval = "10s"
    debug = false
    hostname = "srv1"
    round_interval = true
    flush_interval = "10s"
    flush_jitter = "0s"
    collection_jitter = "0s"
    metric_batch_size = 1000
    metric_buffer_limit = 10000
    quiet = false
    logfile = ""
    omit_hostname = false

###############################################################################
#                                  OUTPUTS                                    #
###############################################################################

[[outputs.influxdb]]
    urls = ["http://211.183.3.101:8086"] # InfluxDB가 설치된 서버의 IP를
    database = "servermetric" # 데이터베에스 이름, 생성이 되어있지 않으면 자동 생>성됨
    timeout = "10s"
    username = "admin" # InfluXDB 기본 계정
    password = "admin"
    retention_policy = ""

###############################################################################
#                                  INPUTS                                     #
###############################################################################

[[inputs.cpu]]
    percpu = true
    totalcpu = true
    collect_cpu_time = false
    report_active = false
[[inputs.disk]]
    ignore_fs = ["tmpfs", "devtmpfs", "devfs"]


[root@srv2-250305 ~]# vi /etc/telegraf/telegraf.conf

# Configuration for telegraf agent
[agent]
    interval = "10s"
    debug = false
    hostname = "srv2"
    round_interval = true
    flush_interval = "10s"
    flush_jitter = "0s"
    collection_jitter = "0s"
    metric_batch_size = 1000
    metric_buffer_limit = 10000
    quiet = false
    logfile = ""
    omit_hostname = false

###############################################################################
#                                  OUTPUTS                                    #
###############################################################################

[[outputs.influxdb]]
    urls = ["http://211.183.3.101:8086"] # InfluxDB가 설치된 서버의 IP를
    database = "servermetric" # 데이터베에스 이름, 생성이 되어있지 않으면 자동 생>성됨
    timeout = "10s"
    username = "admin" # InfluXDB 기본 계정
    password = "admin"
    retention_policy = ""

###############################################################################
#                                  INPUTS                                     #
###############################################################################

[[inputs.cpu]]
    percpu = true
    totalcpu = true
    collect_cpu_time = false
    report_active = false
[[inputs.disk]]
    ignore_fs = ["tmpfs", "devtmpfs", "devfs"]
4. influxdb 패키지 설치 - srv2
[root@srv2-250305 ~]# yum install -y influxdb
5. influxdb 시작 & 활성화 - srv2
[root@srv2-250305 ~]# systemctl status influxdb
● influxdb.service - InfluxDB is an open-source, distributed, time series database
   Loaded: loaded (/usr/lib/systemd/system/influxdb.service; disabled; vendor preset: disabled)
   Active: inactive (dead)
     Docs: https://docs.influxdata.com/influxdb/
[root@srv2-250305 ~]# systemctl enable --now influxdb
Created symlink from /etc/systemd/system/influxd.service to /usr/lib/systemd/system/influxdb.service.
Created symlink from /etc/systemd/system/multi-user.target.wants/influxdb.service to /usr/lib/systemd/system/influxdb.service.
6. telegraf 시작 & 활성화 - srv1 & srv2
[root@srv2-250305 ~]# systemctl status telegraf
● telegraf.service - Telegraf
   Loaded: loaded (/usr/lib/systemd/system/telegraf.service; enabled; vendor preset: disabled)
   Active: inactive (dead)
     Docs: https://github.com/influxdata/telegraf

Mar 05 00:17:34 srv2-250305 systemd[1]: [/usr/lib/systemd/system/telegraf.ser...e'
Mar 05 00:17:34 srv2-250305 systemd[1]: [/usr/lib/systemd/system/telegraf.ser...e'
Mar 05 00:17:34 srv2-250305 systemd[1]: [/usr/lib/systemd/system/telegraf.ser...e'
Mar 05 00:17:34 srv2-250305 systemd[1]: [/usr/lib/systemd/system/telegraf.ser...e'
Mar 05 00:17:34 srv2-250305 systemd[1]: [/usr/lib/systemd/system/telegraf.ser...e'
Mar 05 00:17:34 srv2-250305 systemd[1]: [/usr/lib/systemd/system/telegraf.ser...e'
Mar 05 00:17:34 srv2-250305 systemd[1]: [/usr/lib/systemd/system/telegraf.ser...e'
Mar 05 00:17:34 srv2-250305 systemd[1]: [/usr/lib/systemd/system/telegraf.ser...e'
Mar 05 00:18:58 srv2-250305 systemd[1]: [/usr/lib/systemd/system/telegraf.ser...e'
Mar 05 00:18:58 srv2-250305 systemd[1]: [/usr/lib/systemd/system/telegraf.ser...e'
Hint: Some lines were ellipsized, use -l to show in full.
[root@srv2-250305 ~]# systemctl enable --now telegraf
7. grafana 패키지 설치를 위한 레포지토리 수정 - srv1
[root@srv1-250305 ~]# cat <<EOF | sudo tee /etc/yum.repos.d/grafana.repo
> [grafana]
> name=grafana
> baseurl=https://packages.grafana.com/oss/rpm
> repo_gpgcheck=1
> enabled=1
> gpgcheck=0
> gpgkey=https://packages.grafana.com/gpg.key
> sslverify=1
> sslcacert=/etc/pki/tls/certs/ca-bundle.crt
> EOF
[grafana]
name=grafana
baseurl=https://packages.grafana.com/oss/rpm
repo_gpgcheck=1
enabled=1
gpgcheck=0
gpgkey=https://packages.grafana.com/gpg.key
sslverify=1
sslcacert=/etc/pki/tls/certs/ca-bundle.crt
8. grafana 패키지 설치 - srv1
[root@srv1-250305 ~]# yum install -y grafana
9. grafana 시작 & 활성화 - srv1
[root@srv1-250305 ~]# systemctl enable --now grafana-server
Created symlink from /etc/systemd/system/multi-user.target.wants/grafana-server.service to /usr/lib/systemd/system/grafana-server.service.
10. influxdb 데이터베이스 생성 확인
[root@srv2-250305 ~]# influx
Connected to http://localhost:8086 version v1.11.8
InfluxDB shell version: v1.11.8
> show databases;
name: databases
name
----
_internal
servermetric
11. grafana 접속
12. grafana에 influxdb 연결
13. dashboard 설정
14. dashboard 확인
💡서버 시간 동기화 문제
https://etoile-recording.tistory.com/69
[Linux/VMWare] 서버모니터링 - 서버 시간 동기화 문제 해결 방법
✅시간 동기화 문제 해결 방법문제 파악날짜가 3/5인데 srv1과 srv2의 시간이 2/28로 되어있어서 발생하는 문제➡️ VM을 suspend 하면 발생할 수 있음 해결 방안NTP(Network Time Protocol) : 시간을 동기화
etoile-recording.tistory.com
'CS > Linux' 카테고리의 다른 글
| [VMWare] 24-2. IaC - Ansible & PlayBook (0) | 2025.03.07 |
|---|---|
| [VMWare] 24-1. IaC - Ansible (1) | 2025.03.07 |
| [VMware] 22-1. OpenVSwitch(OVS) (1) | 2025.02.28 |
| [VMware] 20. KVM(Kernel-based Virtual Machine) (1) | 2025.02.15 |
| [VMware] 19-1. VPN - Site to Site VPN (0) | 2025.02.14 |


